
One of the themes of my previous Apple Silicon M1 article - Apple Silicon M1: Black. Magic. Fuckery. - was the stupendous battery life offered by the new M1-based MacBooks. While unveiling the M1 chip, Apple touted the new M1-based MacBook Air and MacBook Pro’s energy efficiency with up to 18 hours and 20 hours of movie playback, 6 and 10 hours more than previous models.
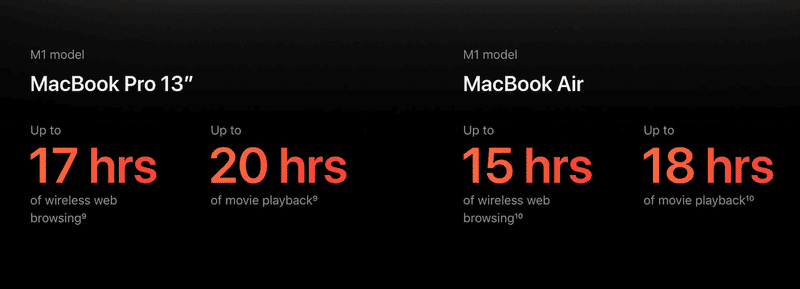
Apple M1 MacBook Pro and MacBook Air battery video playback numbers [Source: Apple]

Apple M1 MacBook Air battery improvement [Source: Apple M1 unveiling event]

Apple M1 MacBook Pro battery improvement [Source: Apple M1 unveiling event]
These battery life advances are massive and typically once-in-a-generation improvements. These are made possible because of Apple’s focus on low-power design and decoding video using specialized hardware engines rather than relying on the general-purpose CPU. Decoding video using a chip built for the sole purpose of decoding video can dramatically affect power consumption, as you will see later in this blog.
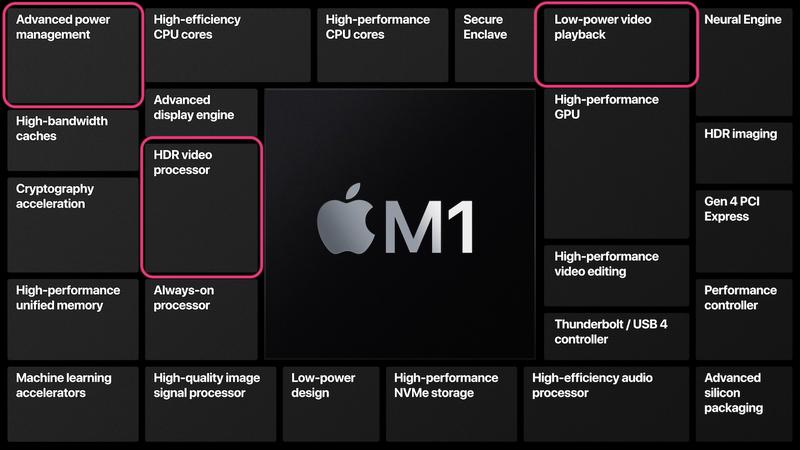
Apple M1 block diagram. Highlighted components are dedicated to low-power video playback [Source: Apple M1 unveiling event]
This blog is Part 1 of a multi-part series of investigations into the actual power these M1 chips consume in some of the most common scenarios. This Part 1 focuses on one of the most critical Pandemic activities - streaming a video from YouTube or Netflix. The lower the power consumption, the longer your battery will last (if you’re not connected to the charger).
Testing Methodology
Software & Hardware
- MacOS 11.2.2 running in safe mode to limit the effect of background processes and other applications on power consumption
- Safari 14.0.3
- Chrome 89 (Apple Silicon version)
- VLC 3.0.12.1 (Apple Silicon version)
- Mac Mini M1 16GB RAM, 256GB SSD (I didn’t have a MacBook so this test represents the power of the M1 components, not the overall system power)
- Peripherels attached: Apple Magic Keyboard and Magic Trackpad (Bluetooth)
Power Consumption Measurement
Power Consumption was measured using Apple’s powermetrics utility. powermetrics is a Mac-only command-line utility that provides many high-quality power-related measurements. It is most useful for getting CPU, GPU and wakeup measurements in a precise and easily scriptable fashion (unlike Activity Monitor and top)
Below is a sample log from powermetrics output after running the following command:
sudo powermetrics -i 1000 --samplers cpu_power,gpu_power -a --hide-cpu-duty-cycle --show-usage-summary --show-extra-power-info -u ~/powerlogs.txt
*** Sampled system activity (Thu Feb 11 00:10:50 2021 -0800) (1004.97ms elapsed) ***

**** Processor usage ****

E-Cluster Power: 14 mW
E-Cluster HW active frequency: 1031 MHz
E-Cluster HW active residency:  11.15% (600 MHz: 2.8% 972 MHz:  88% 1332 MHz: 2.5% 1704 MHz: 3.0% 2064 MHz: 3.5%)
E-Cluster idle residency:  88.85%

P-Cluster Power: 16 mW
P-Cluster HW active frequency: 712 MHz
P-Cluster HW active residency:   2.34% (600 MHz:  90% 828 MHz: .42% 1056 MHz: 1.4% 1284 MHz: 3.0% 1500 MHz: .49% 1728 MHz: .79% 1956 MHz: 1.2% 2184 MHz: .59% 2388 MHz: 1.0% 2592 MHz:   0% 2772 MHz: .40% 2988 MHz: .20% 3096 MHz:   0% 3144 MHz: .20% 3204 MHz: .36%)
P-Cluster idle residency:  97.66%

ANE Power: 0 mW
DRAM Power: 14 mW
Clusters Total Power: 30 mW
GPU Power: 14 mW
Package Power: 99 mW

**** GPU usage ****

GPU active frequency: 709 MHz
GPU active residency:   1.51% (396 MHz: .05% 528 MHz:   0% 720 MHz: 1.5% 924 MHz:   0% 1128 MHz:   0% 1278 MHz:   0%)
GPU requested frequency: (396 MHz:   0% 528 MHz:   0% 720 MHz: 1.5% 924 MHz:   0% 1128 MHz:   0% 1278 MHz:   0%)
GPU idle residency:  98.49%
GPU Power: 14 mW
I wrote a custom Python script to parse out these logs and plot the graphs below. For our purpose, I extracted the following fields:
| Extracted Field | Description | Represented as |
|---|---|---|
| E-Cluster Power | Total power consumption of the 4 high-efficiency cores | Efficiency Cluster |
| P-Cluster Power | Total power consumption of the 4 high-performance cores | Performance Cluster |
| DRAM Power | Power consumption of the embedded RAM | DRAM |
| GPU Power | Power consumption of the M1 GPU | GPU |
| Package Power | Total power consumption of the M1 chip including the CPU, GPU, DRAM and other components like Thunderbolt and SSD controller, media decoding engines, ISP, Secure Enclave etc. | Other |
For an overview of the M1 architecture, see Apple’s official product page and the press release.
If you’re interested in exploring the code that was used to parse the logs, visit the following Github repo
Test 1: YouTube streaming
I tested the following video - “Japan in 8K” - while streaming from YouTube in Safari, Chrome browsers and local file in VLC player.
I included the VLC player in this test to compare against the local playback. VLC currently cannot use the hardware VP9 decoder. Therefore the video is played using the software-based decoder. I also tested Chrome in software-decode mode by forcing the hardware VP9 decoder off using the Chrome flag at chrome://flags/#videotoolbox-vp9-decoding.
This gave us the following test matrix:
| Player | Codec | Resolution | Represented as |
|---|---|---|---|
| VLC (Software) | VP9 | 4K | VLC-SW |
| Chrome (Software) | VP9 | 4K | Chrome-SW |
| Chrome (Hardware) | VP9 | 4K | Chrome-HW |
| Safari (Hardware) | VP9 | 4K | Safari-HW |
To compare against idle state, there was an idle period of 60 seconds before and after playing the video in both scenarios.
Power Consumption
Right off the bat, you can see the difference between the power consumption between hardware decoding and software decoding. Surprisingly, Chrome’s power consumption is higher than Safari’s while both are decoding hardware decoding of VP9 codec.
EDIT 5/21/21: This tweet explains why Chrome’s hardware decoding might have a higher power consumpton.
Looking at the average and total power consumption, I made the following observations:
- Power Consumption for Chrome hardware decoding = 2x Safari hardware decoding 🤨
- Power Consumption for Chrome software decoding is more efficient than VLC software decoding 🧐


CPU & GPU Usage
Looking at the CPU and GPU usage leads to some interesting observations:
- The GPU usage on Safari hardware decoding is nearly 0%.
- Chrome software decoding uses more of the efficiency cluster than VLC software decoding but less of the performance cluster.
- The performance cluster usage jumps between 0% and ~50% in the browsers compared whereas it constantly hovers around 50% in software decoding scenarios. (Select and Zoom in on the graphs to take a closer look.)


CPU & GPU Frequency
Looking at the CPU and GPU usage, I made the following observations:
- In Safari hardware decoding, the GPU frequency is 0 Hz for a sustained period of time. Does this mean the M1 chip can turn the GPU off? This is quite possible because if you look at the Average Power Consumption chart for the same test (Safari hardware decoding), the GPU’s average power consumption was 2mw! Let me type that again. Over 4-5 minutes where the Apple M1 chip played a 4K video in Safari browser, the GPU consumed only 2 milliwatts!
- The average frequencies are almost neck and neck for hardware decoding modes (except GPU) and higher in software decoding modes.
- With VLC, the GPU is consistently around 715 MHz, even in the idle phase (i.e. video not playing).


Test 2: Netflix streaming
For this test, I streamed Queen’s Gambit from Netflix in both Safari and Chrome browsers. Just like the last test to compare against the idle state, there was an idle period of 60 seconds before and after playing the video in both scenarios. The footage in this test was played for 60 seconds.
The are two interesting parts to Netflix streaming between these browsers:
- Safari can stream in 1080p and 4K, while Chrome is limited to 720p due to hardware-based DRM limitations. Netflix states that to stream in Ultra HD, one needs a device with an Apple T2 Security chip.
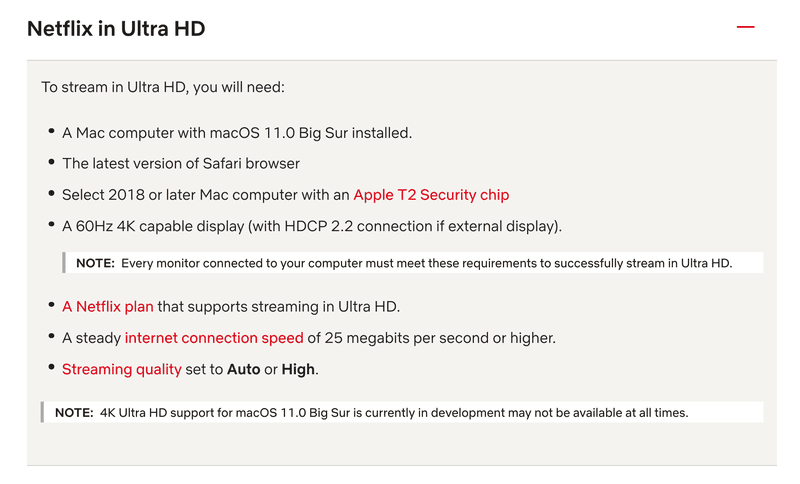
Netflix requirements for streaming in Ultra HD on Mac [Source: Netflix]
- Safari streamed this title in H.265/HEVC codec while Chrome streams in VP9.
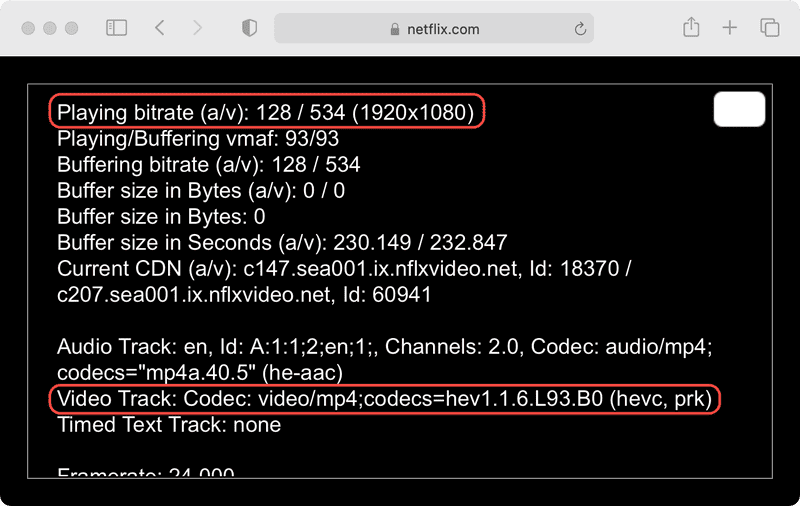
Netflix Queen’s Gambit streaming on Safari [Source: Netflix]
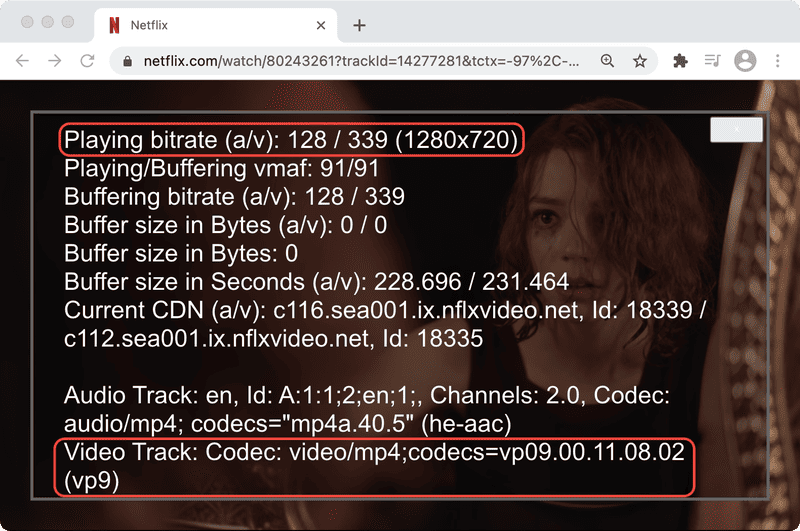
Netflix Queen’s Gambit streaming on Chrome [Source: Netflix]
Power Consumption
Overall, both browsers end up being similar in the average and total power consumption numbers.


However, once you dig down into individual components, we notice some interesting details.
- On the M1, the DRAM usage in Safari is really high! It’s more than both the CPU clusters. It’s most likely because Safari is streaming 1080p vs. Chrome’s 720p stream.
- The “Other” component is consuming ~2x the power in Safari vs. Chrome. This is most likely due to the T2 chip being leveraged because of hardware DRM implementation.
- Just like the YouTube test, Chrome seems to be leveraging quite a bit of GPU. It’s the component that consumes the most power.


CPU & GPU Usage
No surprises looking at the usage charts than what we already gleaned from the power consumption charts i.e. GPU usage in Chrome is much higher.


CPU & GPU Frequency
Some interesting things are going on with the GPU on the frequency charts.
- In Safari, the GPU is clocking up and down (zoom in on the details), while in Chrome, the GPU is constantly running around 710 MHz.
- The performance cluster runs around 600 Mhz most of the time but has periodic jumps to almost 3.2 GHz (max frequency for the cluster as confirmed by Anandtech).


Conclusion
Hopefully, that was an insightful look into the M1 power characteristics! Stay tuned for Part 2, where I’ll dig into similar details but this time with local playback.
Also, I hear Big Sur 11.3 will finally allow Safari to play VP9 files. If it changes any of the numbers here in any meaningful way, I’ll update this blog.
Stay tuned for the updates by subscribing to the RSS Feed or the Mailing List
Buy
If you’re planning on buying an Apple M1 product, you can support this blog by using my affiliate links below:
MacBook Air M1 (2020)
- Apple MacBook Air with Apple M1 Chip (13-inch, 8GB RAM, 256GB SSD Storage) - Space Gray
- Apple MacBook Air with Apple M1 Chip (13-inch, 8GB RAM, 512GB SSD Storage) - Space Gray
- Apple MacBook Air with Apple M1 Chip (13-inch, 16GB RAM, 1TB SSD Storage) - Space Gray
MacBook Pro M1 (2020)
- Apple MacBook Air with Apple M1 Chip (13-inch, 8GB RAM, 256GB SSD Storage) - Space Gray
- Apple MacBook Pro with Apple M1 Chip (13-inch, 8GB RAM, 512GB SSD Storage) - Silver
- Apple MacBook Pro with Apple M1 Chip (13-inch, 16GB RAM, 256GB SSD Storage) - Space Gray
Contact
Reach out if you have any questions! Feel free to follow me on
- Twitter - @singhkays
- LinkedIn - https://www.linkedin.com/in/singhkays/